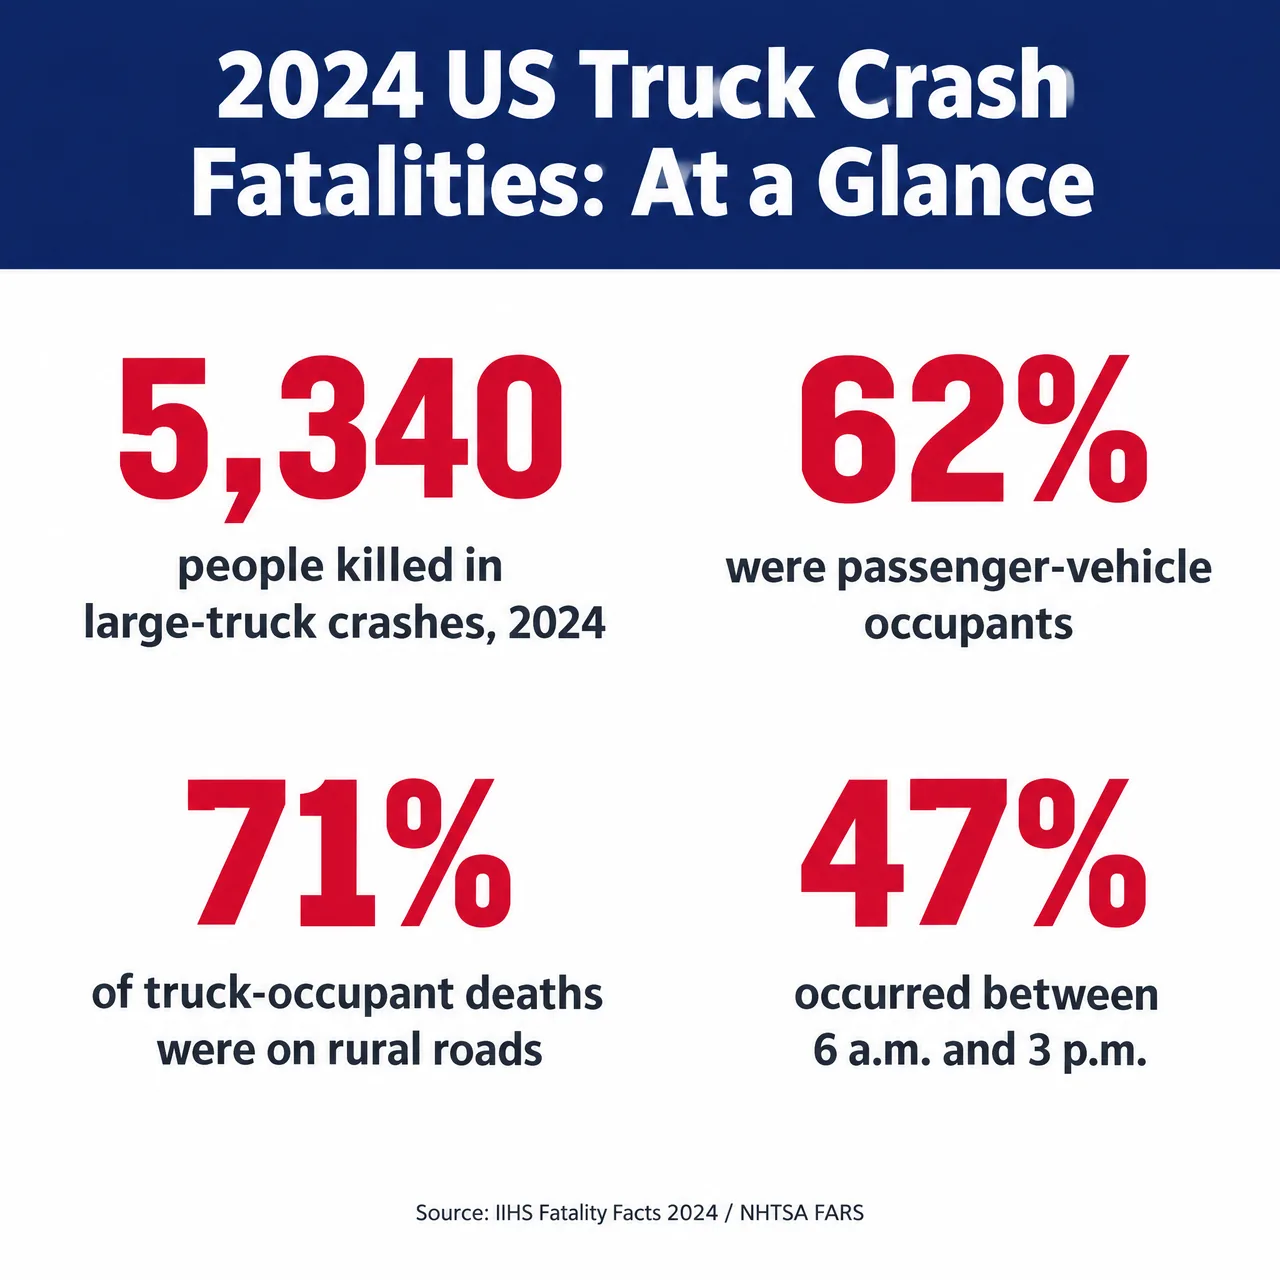
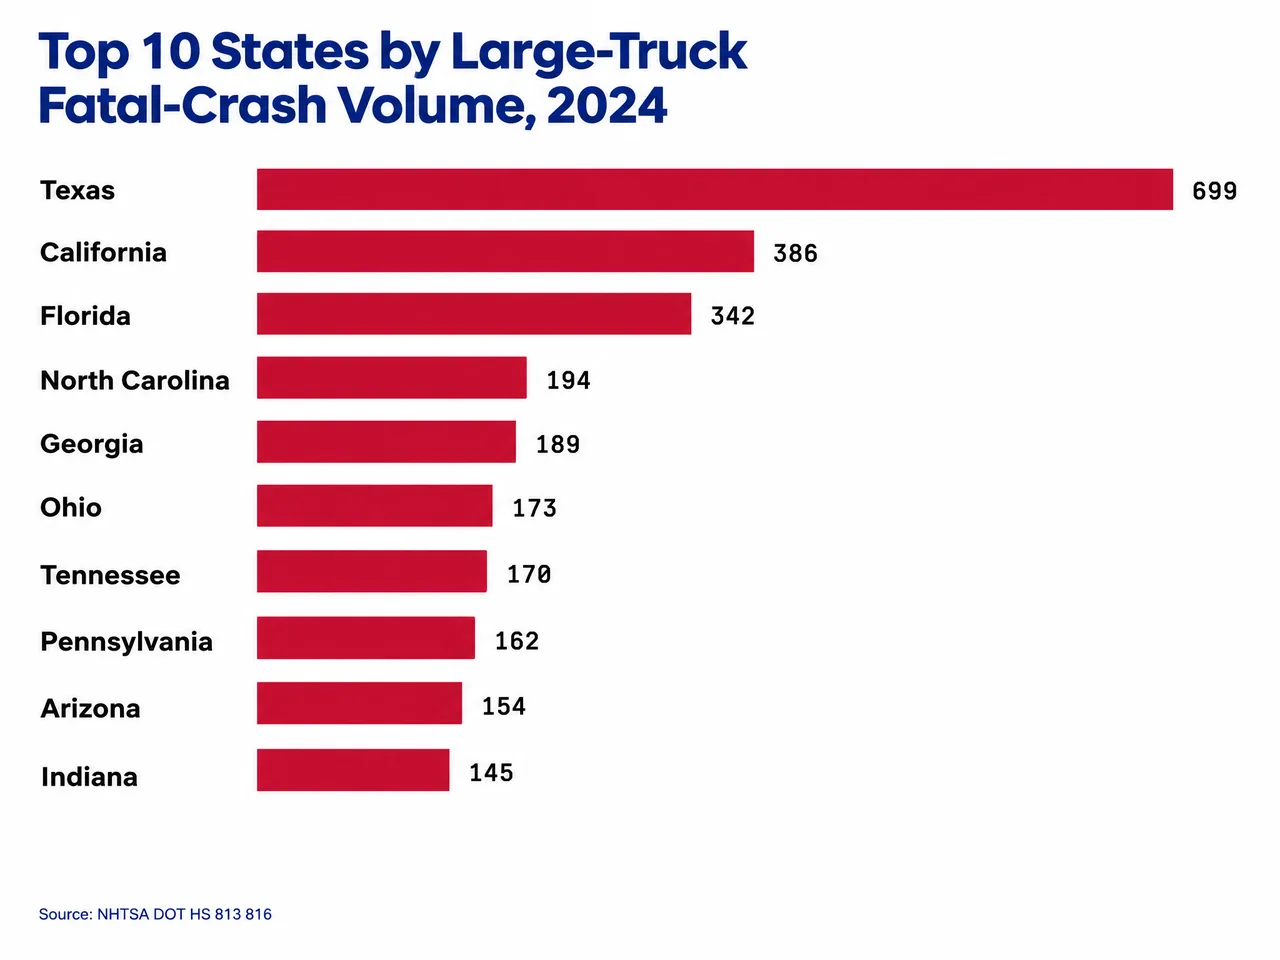
5,340 people were killed in crashes involving a large truck in the United States in 2024, per NHTSA FARS — down 2.5% from 2023 but 58% higher than the 2009 baseline of 3,380. Texas led on absolute count (699 large trucks in fatal crashes); North Dakota led on share (18.1% of that state's fatal crashes involved a large truck).

The federal record on large-truck traffic fatalities is public, but it is not aggregated in one place a consumer can read. NHTSA publishes national totals; FMCSA publishes broader carrier-reported data that produces slightly higher counts; IIHS publishes rate normalizations; state DOTs publish state-level detail. This article pulls the pieces together for 2024 — every 50-state count, the two rate metrics that keep getting confused, the ten-year trend, and the breakdown of who is dying — with a single source citation per number.
If a large truck crash has affected you or a family member, evidence preservation runs on the clock. A big rig truck accident lawyer can start the preservation process before records disappear on carrier retention schedules; start with a free case review.
The 2024 headline: 5,340 deaths, 5,218 trucks
Two figures show up in NHTSA's own reporting for 2024, and both are correct — they measure different things on the same set of crashes:
- 5,340 people killed. This is the FARS count of human fatalities in crashes involving at least one large truck. It is the headline number IIHS reports as "deaths in large-truck crashes."
- 5,218 large trucks in fatal crashes. This is the count of large-truck vehicles that were in a fatal crash. Some fatal crashes involve multiple large trucks; some kill several people. The two totals are not comparable directly.
When quoting a figure, cite the denominator. In a brief, use "5,340 people killed" for the human toll, and "5,218 large trucks involved" only when you are discussing the vehicle count.
Who dies in these crashes
The victims are not, in the majority, the truck driver. Per IIHS Fatality Facts 2024:
- 62% of the 5,340 people killed were occupants of passenger vehicles (cars, SUVs, pickups) — 3,293 people.
- 17% were occupants of the large truck itself — 920 people.
- 19% were pedestrians, cyclists, or motorcyclists — 1,021 people.
71% of large-truck occupant fatalities in 2024 occurred in rural areas. That geographic concentration matters for both response time (rural EMS access) and for the reality that interstate commerce trucking is concentrated in long-haul corridors that pass through less-populated states.
Top 10 states by absolute count
| Rank | State | Large trucks in fatal crashes (2024) |
|---|---|---|
| 1 | Texas | 699 |
| 2 | California | 386 |
| 3 | Florida | 342 |
| 4 | North Carolina | 194 |
| 5 | Georgia | 189 |
| 6 | Ohio | 173 |
| 7 | Tennessee | 170 |
| 8 | Pennsylvania | 162 |
| 9 | Arizona | 154 |
| 10 | Indiana | 145 |
Volume is a function of population and truck-mileage exposure. Texas is both the most populous truck-corridor state and the highest interstate freight volume state; the count follows. For California-specific detail, see the homepage — our funnel is California-first for a reason.
Top 10 states by share of fatal crashes involving a large truck
| Rank | State | % of state fatal crashes involving a large truck (2024) |
|---|---|---|
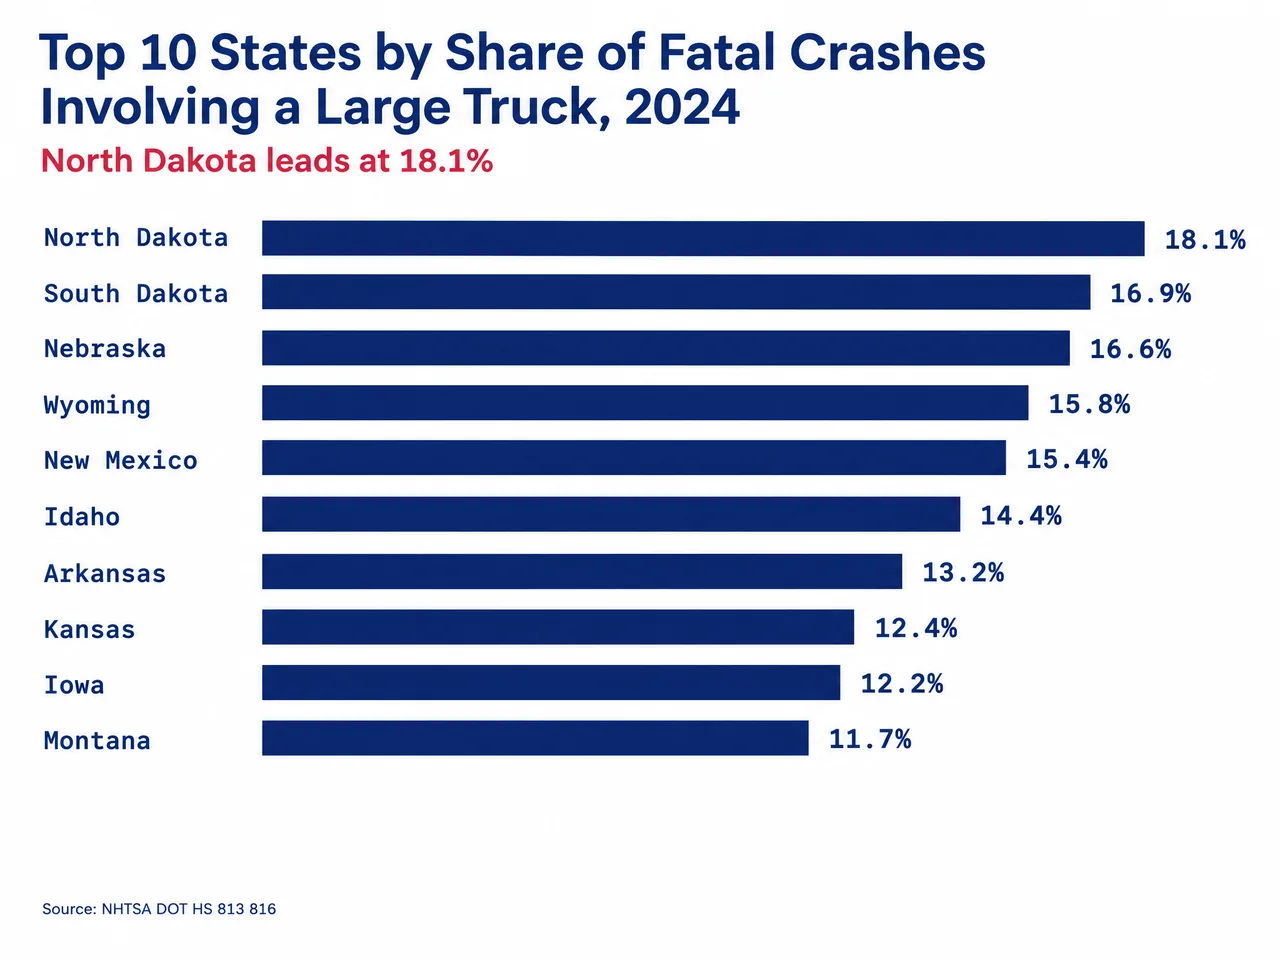
| 1 | North Dakota | 18.1% |
| 2 | South Dakota | 16.9% |
| 3 | Nebraska | 16.6% |
| 4 | Wyoming | 15.8% |
| 5 | New Mexico | 15.4% |
| 6 | Idaho | 14.4% |
| 7 | Arkansas | 13.2% |
| 8 | Kansas | 12.4% |
| 9 | Iowa | 12.2% |
| 10 | Montana | 11.7% |
The share leaders are almost exclusively low-population, long-haul corridor states. North Dakota's 18.1% does not mean North Dakota has more truck crashes than Texas — it has far fewer — but it means that of the fatal crashes that happen there, nearly one in five involves a large truck. That is a signal about exposure per capita and about the type of road (rural interstate, long line-of-sight).
The bottom of the share table is the mirror. Hawaii (1.5%), District of Columbia (1.6%), and Puerto Rico (3.1%) all have geographies where long-haul trucking is a small share of overall driving. Massachusetts (5.8%), Vermont (6.0%), and New Hampshire (6.2%) sit at the bottom of the continental U.S. share table.
The full 50-state + DC + Puerto Rico table
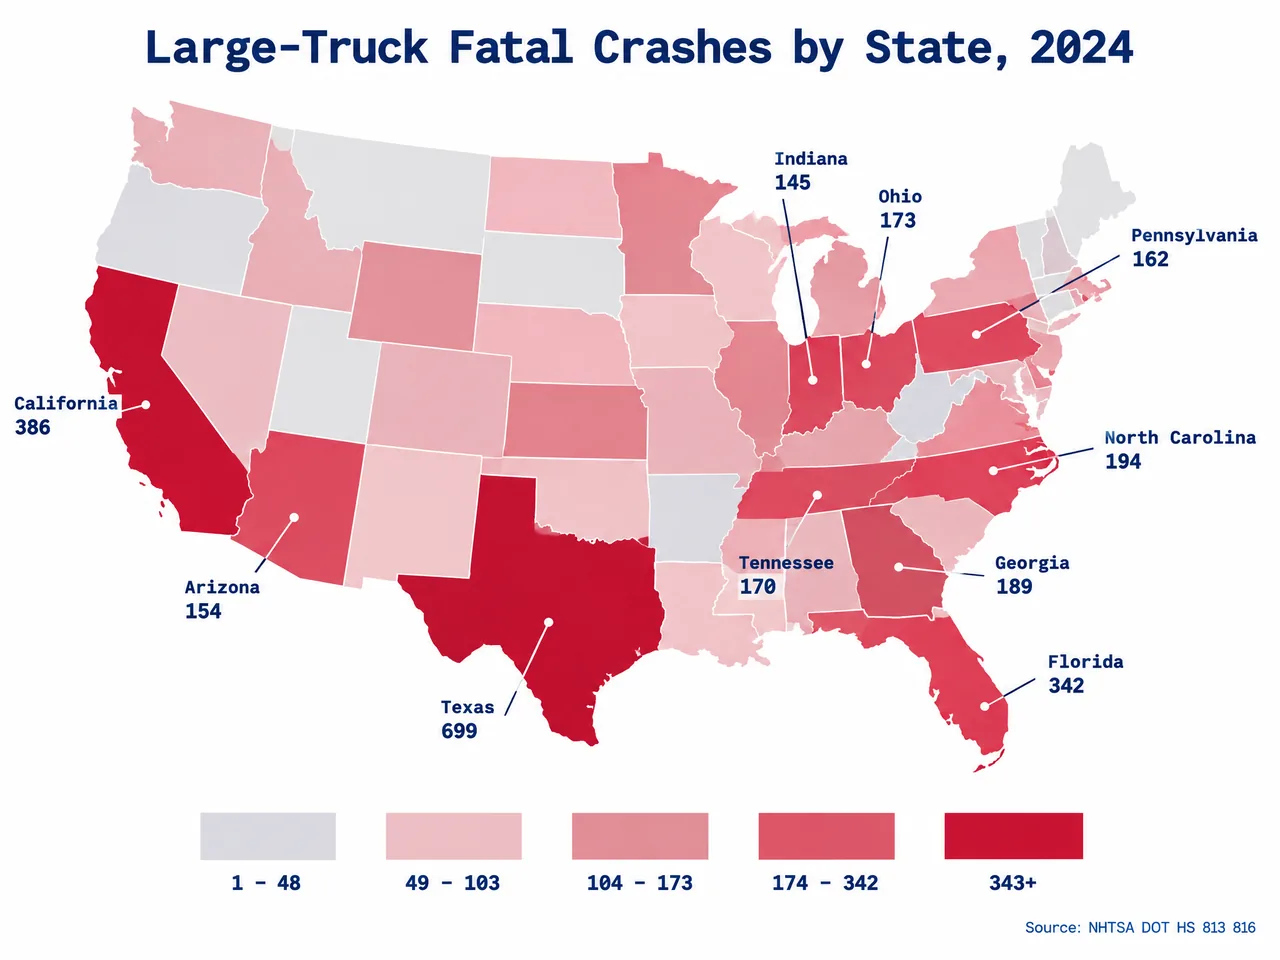
Sorted alphabetically. All figures are large trucks in fatal crashes and share of that state's fatal crashes for 2024, per NHTSA DOT HS 813 816, Table 6.
| State | Large trucks in fatal crashes (2024) | % of state fatal crashes |
|---|---|---|
| Alabama | 140 | 10.4% |
| Alaska | 10 | 9.6% |
| Arizona | 154 | 8.6% |
| Arkansas | 108 | 13.2% |
| California | 386 | 7.2% |
| Colorado | 98 | 9.6% |
| Connecticut | 31 | 7.2% |
| Delaware | 12 | 6.5% |
| District of Columbia | 1 | 1.6% |
| Florida | 342 | 7.4% |
| Georgia | 189 | 9.5% |
| Hawaii | 2 | 1.5% |
| Idaho | 47 | 14.4% |
| Illinois | 144 | 8.6% |
| Indiana | 145 | 11.4% |
| Iowa | 59 | 12.2% |
| Kansas | 61 | 12.4% |
| Kentucky | 89 | 8.6% |
| Louisiana | 91 | 8.8% |
| Maine | 28 | 10.9% |
| Maryland | 63 | 7.3% |
| Massachusetts | 30 | 5.8% |
| Michigan | 107 | 6.7% |
| Minnesota | 73 | 11.0% |
| Mississippi | 96 | 9.9% |
| Missouri | 143 | 10.4% |
| Montana | 33 | 11.7% |
| Nebraska | 59 | 16.6% |
| Nevada | 39 | 6.5% |
| New Hampshire | 12 | 6.2% |
| New Jersey | 67 | 7.0% |
| New Mexico | 92 | 15.4% |
| New York | 118 | 7.9% |
| North Carolina | 194 | 8.3% |
| North Dakota | 23 | 18.1% |
| Ohio | 173 | 10.2% |
| Oklahoma | 105 | 11.3% |
| Oregon | 71 | 9.7% |
| Pennsylvania | 162 | 9.7% |
| Rhode Island | 4 | 6.5% |
| South Carolina | 135 | 9.2% |
| South Dakota | 33 | 16.9% |
| Tennessee | 170 | 9.7% |
| Texas | 699 | 11.6% |
| Utah | 46 | 11.2% |
| Vermont | 4 | 6.0% |
| Virginia | 125 | 9.8% |
| Washington | 71 | 6.7% |
| West Virginia | 39 | 10.9% |
| Wisconsin | 73 | 8.9% |
| Wyoming | 22 | 15.8% |
| Puerto Rico | 12 | 3.1% |
| US total | 5,218 | — |
A single US total of 5,218 is the trucks-involved count. The people-killed figure across the same crashes is 5,340. Both are in the same NHTSA publication.
Reading the state table for your case? See who can be held liable after a truck crash and what compensation may cover, then start a free case review.
Two rate metrics — and why they are not the same number
Any comparison of state safety by fatality rate needs a rate — a count normalized by exposure. NHTSA and IIHS both publish rates, but they measure different things. Do not mix them.
| Metric | What is in the denominator | Value | Source |
|---|---|---|---|
| Truck-occupant fatality rate | People killed inside the truck only | 0.29 per 100M truck-VMT (2023) | IIHS |
| Large-truck involvement rate | Large trucks in fatal crashes (whoever died) | 1.58 per 100M truck-VMT (2024) | NHTSA DOT HS 813 816 |
The two numbers are far apart because they measure different things. If you cite both, label each denominator explicitly. In a plaintiff argument, the involvement rate is usually the more useful number because it captures the full harm caused by trucking, not just harm to the trucker.
The ten-year trajectory: +58% since 2009
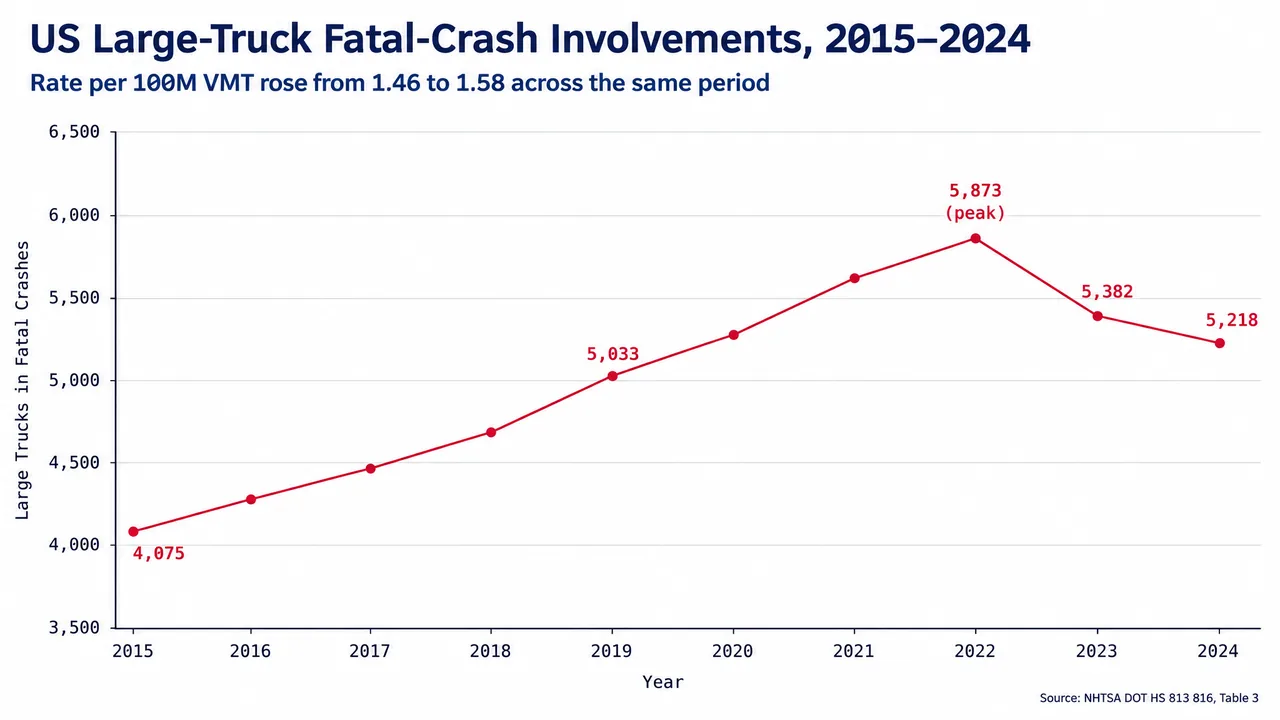
The 2024 total is not an anomaly. Large trucks in fatal crashes have risen from 4,075 in 2015 to 5,218 in 2024 per NHTSA — a 28% increase in a decade. Per-VMT rates rose from 1.46 to 1.58 over the same period, so the increase is not entirely explained by more miles driven.
The 2024 figure (5,218 trucks / 5,340 people) is 2.5% below the 2023 peak but is still 58% above the 2009 baseline of 3,380 people killed. Whether the 2023-to-2024 dip continues will not be knowable until the 2025 FARS release, which usually publishes in mid-to-late 2026.
What state-level fatality volume means for a case
State-level counts are context, not case law. What actually determines the outcome of a truck accident claim is:
- Whether the evidence was preserved — engine control module data, ELD records, dashcam footage, and dispatch records have short retention windows. See FMCSA regulations and the evidence that wins truck accident cases.
- Whether the crash falls within the statute of limitations for the state where it occurred.
- Who can be held liable — the driver, the carrier, the broker, the shipper, the maintenance contractor, the manufacturer, or a combination.
- The specific causes of the crash — fatigue, brake failure, jackknife, underride, blind-spot events all have different evidentiary requirements.
- The injuries sustained and the resulting compensation categories the case supports.
Methodology and freshness
Every number above is from a primary source published in 2024, 2025, or 2026. State counts come from NHTSA DOT HS 813 816 (June 2026), Table 6. Rate figures are labeled by their source publication and year. The 10-year trend uses NHTSA DOT HS 813 816 Table 3.
FMCSA MCMIS reports a slightly higher 2024 total (5,600 people killed) than NHTSA FARS (5,340). Both are official; the difference reflects different collection methodologies (FARS is a NHTSA census of fatal-crash records; MCMIS is FMCSA's carrier-reporting file aggregated from state reports). For national fatality counts, FARS is the standard citation.
Historical "most dangerous state per capita" rankings commonly repeated in law-firm blog content (often naming Wyoming, Arkansas, or Oklahoma) trace to 2005 data. They are not included in the tables above because they are stale by two decades.
If you or a family member was hurt in a large-truck crash, the clock started at the crash. Records are already on retention schedules. Start with a free case review — no cost, no obligation.
Sources
- Large Trucks: 2024 Data (Traffic Safety Facts, DOT HS 813 816) — NHTSA
- IIHS Fatality Facts 2024: Large Trucks — Insurance Institute for Highway Safety
- FMCSA Motor Carrier Safety Progress Report (Sept 2024) — FMCSA
- NHTSA State Traffic Data 2023 (DOT HS 813 743) — NHTSA
- FMCSA A&I Crash Statistics Portal — FMCSA
- NSC Injury Facts — Large Trucks — National Safety Council
Federal regulations and crash statistics are updated periodically. Figures cited on this page reflect the referenced publications at the time of writing; check the source for the current edition.